
- BY Admin
- POSTED IN Articles
- WITH 0 COMMENTS
- PERMALINK
- STANDARD POST TYPE
Radio astronomy is a subfield of astronomy that studies celestial objects at radio frequencies. The initial detection of radio waves from an astronomical object (the Milky Way) was made in the 1930s, but subsequent advances (especially post-World War II) have identified a number of different sources of radio emission. These include stars and galaxies as well as entirely new classes of objects, such as Radio Galaxies, Pulsars and Masers. The discovery of the Cosmic Microwave Background Radiation was a particularly significant event. Radio astronomy is conducted using large radio antenna referred to as radio telescopes, that are either used singularly, or with multiple linked telescopes utilizing the techniques of radio interferometry and aperture synthesis. The latter has allowed radio sources to be imaged with unprecedented angular resolution.
The idea that celestial bodies may be emitting radio waves had been suspected some time before its discovery. In the 1860s James Clerk Maxwell’s equations had shown that electromagnetic radiation from stellar sources could exist with any wavelength, not just optical. Several notable scientists and experimenters such as Nikola Tesla, Oliver Lodge, and Max Planck predicted that the sun should be emitting radio waves. Lodge tried to observe solar signals but was unable to detect them due to technical limitations of his apparatus.
The first identified astronomical radio source was one discovered serendipitously in the early 1930s when Karl Guthe Jansky, an engineer with Bell Telephone Laboratories, was investigating static that interfered with short wave transatlantic voice transmissions. Using a large directional antenna, Jansky noticed that his analog pen-and-paper recording system kept recording a repeating signal of unknown origin. Since the signal peaked about every 24 hours, Jansky originally suspected the source of the interference was the Sun crossing the view of his directional antenna. Continued analysis showed that the source was not following the 24 hour daily cycle of the Sun exactly, but instead repeating on a cycle of 23 hours and 56 minutes. Jansky discussed the puzzling phenomena with his friend, astrophysicist and teacher Albert Melvin Skellett, who pointed out that signal seemed to be typical of an astronomical source “fixed” in relationship to the stars on the celestial sphere rotating in sync with sidereal time. By comparing his observations with optical astronomical maps, Jansky eventually concluded that the radiation was coming from the Milky Way and was strongest in the direction of the center of the galaxy, in the constellation of Sagittarius . He also concluded that since he was unable to detect radio noise from the Sun, the strange radio interference may be generated by interstellar gas and dust in the galaxy (which later proved correct). He announced his discovery in 1933. Jansky wanted to investigate the radio waves from the Milky Way in further detail but Bell Labs re-assigned him to another project, so he did no further work in the field of astronomy. However, his pioneering efforts in the field of radio astronomy have been recognized by the naming of the fundamental unit of radio flux density, the Jansky (Jy), after him.
Grote Reber also helped pioneer radio astronomy when he built a large parabolic “dish” radio telescope (9m in diameter) in 1937. He was instrumental in repeating Karl Jansky’s pioneering but somewhat simple work, and went on to conduct the first sky survey in the radio frequencies . On February 27, 1942, J.S. Hey, a British Army research officer, helped progress radio astronomy further, when he discovered that the sun emitted radio waves . By the early 1950s Martin Ryle and Antony Hewish at Cambridge University had used the Cambridge Interferometer to map the radio sky, producing the famous 2C and 3C surveys of radio sources.
Techniques
Radio astronomers use different types of techniques to observe objects in the radio spectrum. Instruments may simply be pointed at an energetic radio source to analyze what type of emissions it makes. To “image” a region of the sky in more detail, multiple overlapping scans can be recorded and piece together in an image (‘mosaicing’). The types of instruments being used depends on the weakness of the signal and the amount of detail needed.
Radio telescopes
Main article: Radio telescope
M87 optical image.jpg
An optical image of the galaxy M87 (HST), a radio image of same galaxy using Interferometry (Very Large Array-VLA), and an image of the center section (VLBA) using a Very Long Baseline Array (Global VLBI) consisting of antennas in the US, Germany, Italy, Finland, Sweden and Spain. The jet of particles is suspected to be powered by a black hole in the center of the galaxy.
Radio telescopes may need to be extremely large in order to receive signals with high signal-to-noise ratio. Also since angular resolution is a function of the diameter of the “objective” in proportion to the wavelength of the electromagnetic radiation being observed, radio telescopes have to be much larger in comparison to their optical counterparts. For example a 1 meter diameter optical telescope is two million times bigger than the wavelength of light observed giving it a resolution of roughly 0.3 arc seconds, whereas a radio telescope “dish” many times that size may, depending on the wavelength observed, only be able to resolve an object the size of the full moon (30 minutes of arc).
Radio interferometry
The difficulty in achieving high resolutions with single radio telescopes led to radio interferometry, developed by British radio astronomer Martin Ryle and Australian-born engineer, radiophysicist, and radio astronomer Joseph Lade Pawsey and Ruby Payne-Scott in 1946. Surprisingly the first use of a radio interferometer for an astronomical observation was carried out by Payne-Scott, Pawsey and Lindsay McCready on 26 January 1946 using a SINGLE converted radar antenna (broadside array) at 200 MHz near Sydney, Australia. This group used the principle of a sea-cliff interferometer in which the antenna (formerly a WWII radar) observed the sun at sunrise with interference arising from the direct radiation from the sun and the reflected radiation from the sea. With this baseline of almost 200 meters, the authors determined that the solar radiation during the burst phase was much smaller than the solar disk and did arise from a region associated with a large sunspot group. The Australia group laid out the principles of aperture synthesis in their ground breaking paper submitted in mid 1946 and published in 1947. The use of a sea-cliff interferometer had been demonstrated by numerous groups in Australia and the UK during World War II, who had observed interference fringes (the direct radar return radiation and the reflected signal from the sea) from incoming aircraft.
The Cambridge group of Ryle and Vonberg observed the sun at 175 MHz for the first time in mid July 1946 with a Michelson interferometer consisting of a two radio antennas with spacings of some tens of meters up to 240 meters. They showed that the radio radiation was smaller than 10 arc min in size and also detected circular polarization in the Type I bursts. Two other groups had also detected circular polarization at about the same time (David Martyn in Australia and Edward Appleton with J. Stanley Hey in the UK).
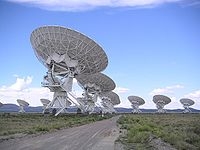
Modern Radio interferometers consist of widely separated radio telescopes observing the same object that are connected together using coaxial cable, waveguide, optical fiber, or other type of transmission line. This not only increases the total signal collected, it can also be used in a process called Aperture synthesis to vastly increase resolution. This technique works by superposing (interfering) the signal waves from the different telescopes on the principle that waves that coincide with the same phase will add to each other while two waves that have opposite phases will cancel each other out. This creates a combined telescope that is the size of the antennas furthest apart in the array. In order to produce a high quality image, a large number of different separations between different telescopes are required (the projected separation between any two telescopes as seen from the radio source is called a baseline) – as many different baselines as possible are required in order to get a good quality image. For example the Very Large Array has 27 telescopes giving 351 independent baselines at once.
Very Long Baseline Interferometry
Beginning in the 1970s, improvements in the stability of radio telescope receivers permitted telescopes from all over the world (and even in Earth orbit) to be combined to perform Very Long Baseline Interferometry. Instead of physically connecting the antennas, data received at each antenna is paired with timing information, usually from a local atomic clock, and then stored for later analysis on magnetic tape or hard disk. At that later time, the data is correlated with data from other antennas similarly recorded, to produce the resulting image. Using this method it is possible to synthesise an antenna that is effectively the size of the Earth. The large distances between the telescopes enable very high angular resolutions to be achieved, much greater in fact than in any other field of astronomy. At the highest frequencies, synthesised beams less than 1 milliarcsecond are possible.
The pre-eminent VLBI arrays operating today are the Very Long Baseline Array (with telescopes located across the North America) and the European VLBI Network (telescopes in Europe, China, South Africa and Puerto Rico). Each array usually operates separately, but occasional projects are observed together producing increased sensitivity. This is referred to as Global VLBI. There is also a VLBI network, the Long Baseline Array, operating in Australia.
Since its inception, recording data onto hard media has been the only way to bring the data recorded at each telescope together for later correlation. However, the availability today of worldwide, high-bandwidth optical fibre networks makes it possible to do VLBI in real time. This technique (referred to as e-VLBI) was pioneered by the EVN (European VLBI Network) who now perform an increasing number of scientific e-VLBI projects per year.


